Charts
| Support | |
|---|---|
| Events | No |
You can display data rendered as a chart by using New-PodeWebChart, and the following chart types are supported:
- Line (default)
- Bar
- Pie
- Doughnut
A chart gets its data from a supplied -ScriptBlock, more information below, and you can set a -MaxItems to be shown, and whether new data points should -Append to the chart. You can also -AutoRefresh a chart, to fetch new data every minute.
Data
To supply data to be rendered on a chart, you have to supply a -ScriptBlock which returns the appropriate data in the correct format; fortunately there's ConvertTo-PodeWebChartData to help with this format.
You can pass values to the scriptblock by using the -ArgumentList parameter. This accepts an array of values/objects, and they are supplied as parameters to the scriptblock:
New-PodeWebChart -Name 'Example Chart' -Type Line -ArgumentList 'Value1', 2, $false -ScriptBlock {
    param($value1, $value2, $value3)

    # $value1 = 'Value1'
    # $value2 = 2
    # $value3 = $false
}
Raw
Before showing the ConvertTo function, the data format needed is as follows: the returned value has to be an array of hashtables, with each hashtable requiring a Key property, and a Values property that's an array of further hashtables. The Key is the value used on the X-axis, and the Values are an array of data points used on the Y-axis. The Values hashtables also need to contain a Key and a Value property - the Key here is the dataset group name, and the Value is the value on the Y-axis.
For example, the below will show a line chart consisting of 10 data points across 2 groups: Group1/Group2:
New-PodeWebContainer -Content @(
    New-PodeWebChart -Name 'Example Chart' -Type Line -ScriptBlock {
        return (1..10 | ForEach-Object {
            @{
                Key = $_ # x-axis value
                Values = @(
                    @{
                        Key = 'Group1'
                        Value = (Get-Random -Maximum 10) # y-axis value
                    }
                    @{
                        Key = 'Group2'
                        Value = (Get-Random -Maximum 10) # y-axis value
                    }
                )
            }
        })
    }
)
which renders a chart that looks like below:
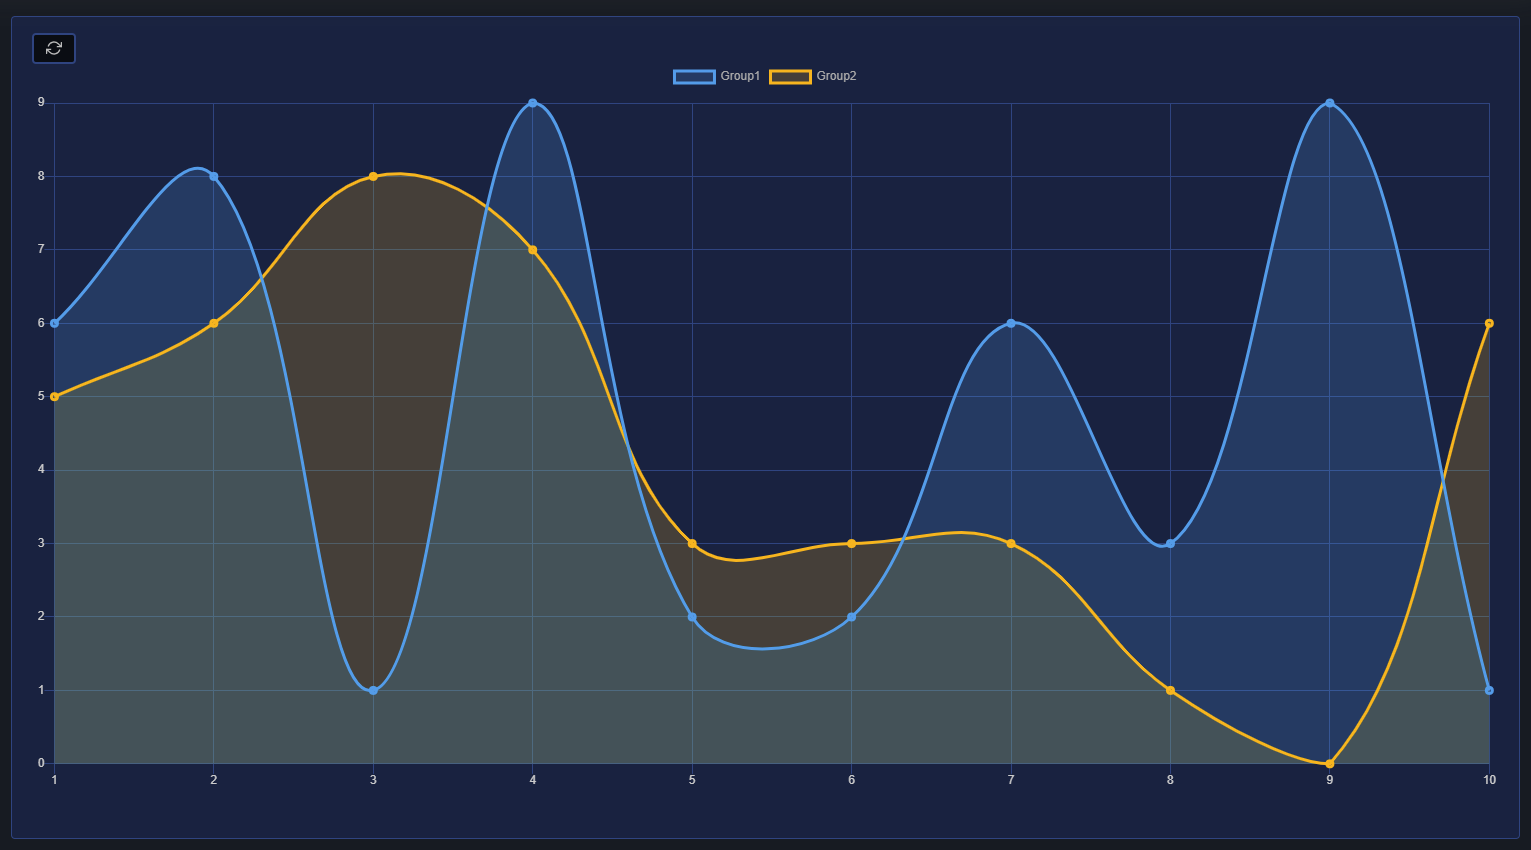
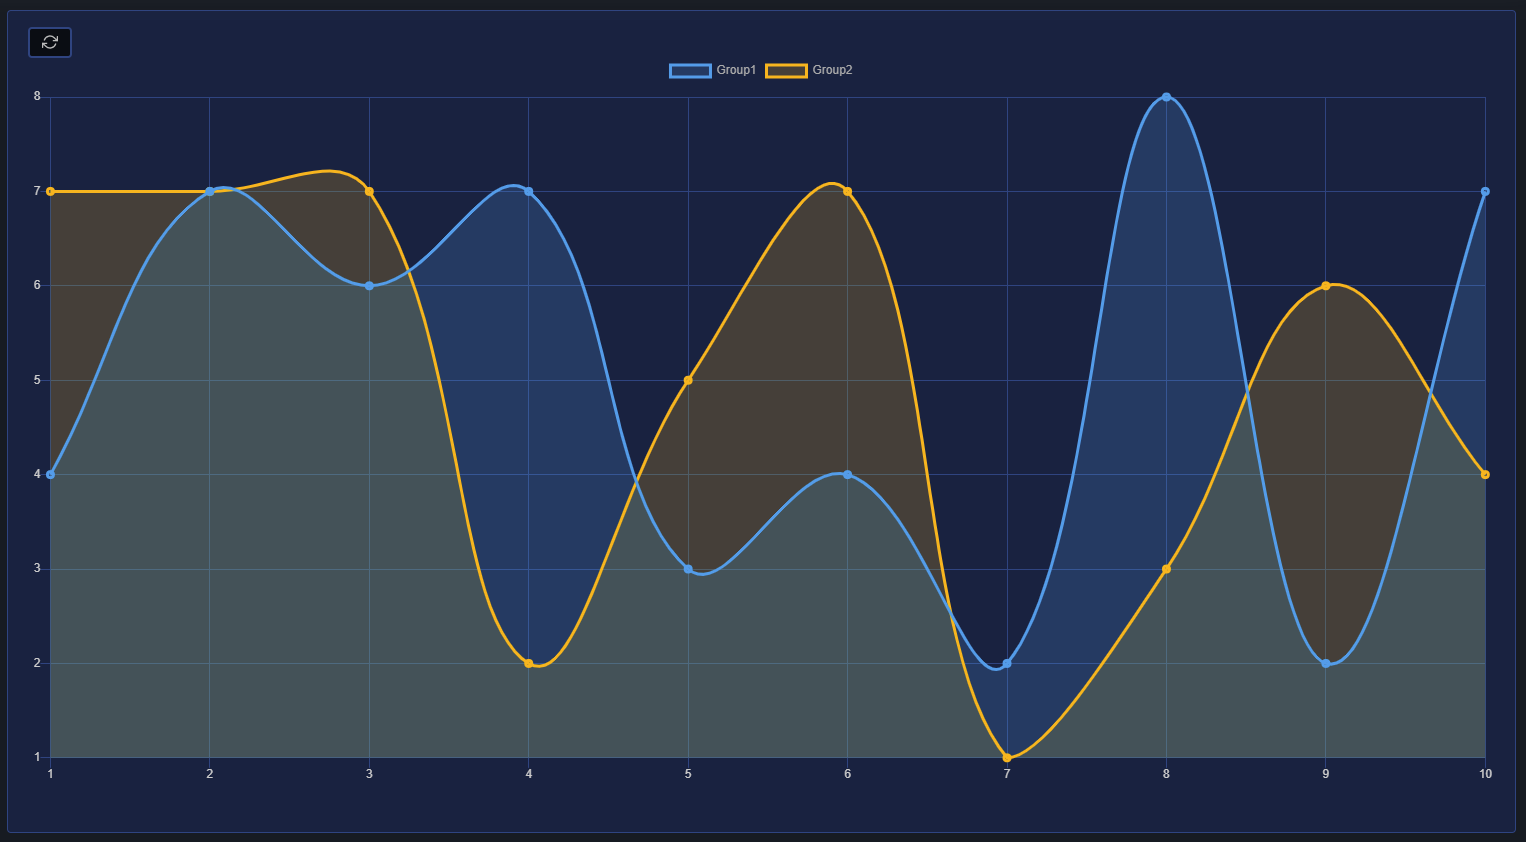
If you click the refresh button in the top-left corner, the -ScriptBlock will be re-invoked, and the chart updated:
ConvertTo
The ConvertTo-PodeWebChartData helps to simplify the above raw format, by letting you convert data at the end of a pipeline. The function takes a -LabelProperty which is the name of a property in the input that should be used for the X-axis, and then a -DatasetProperty with its property names for Y-axis values.
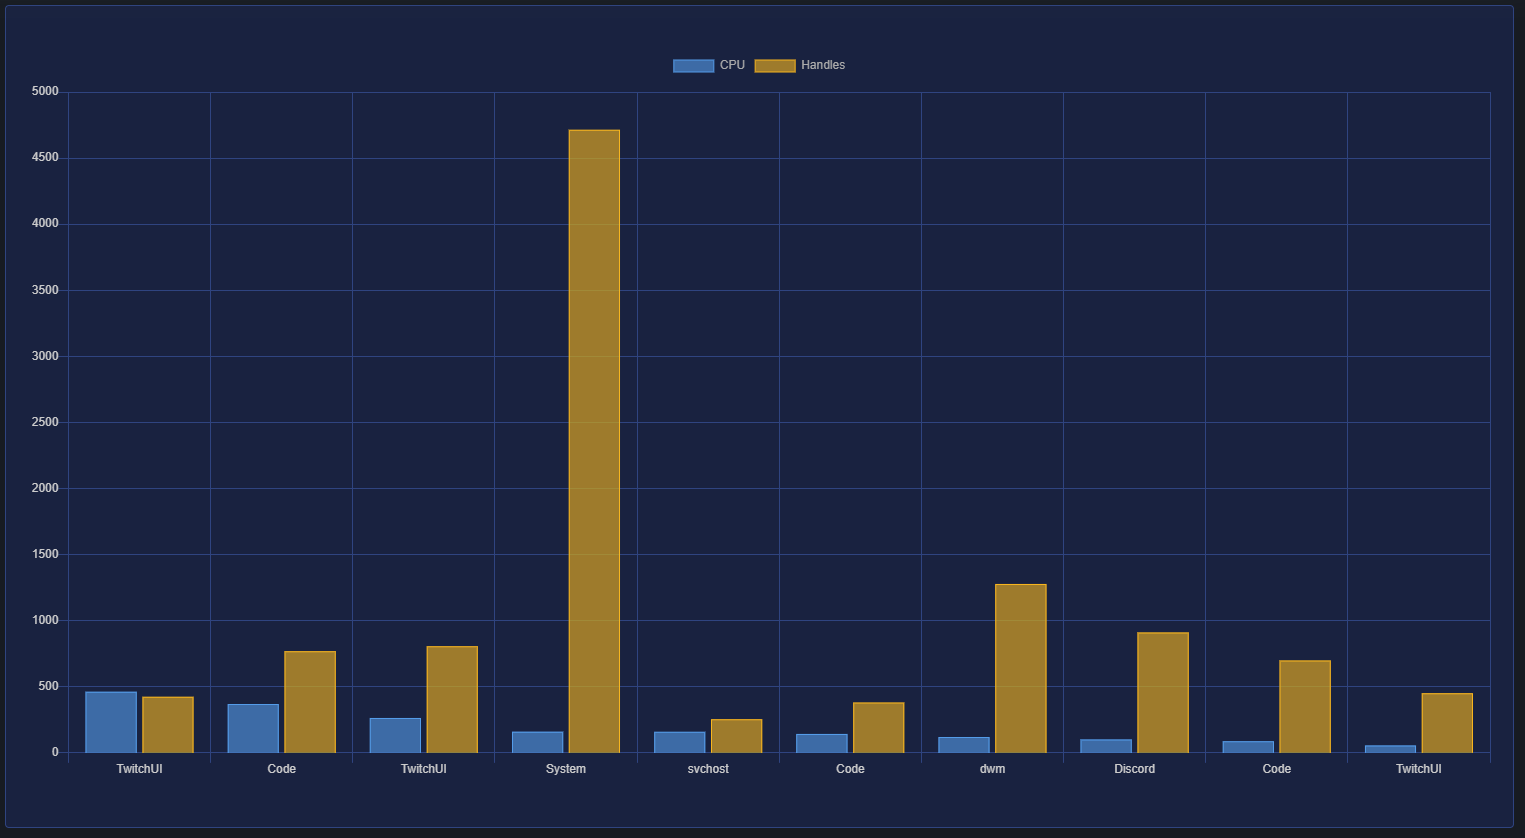
For example, let's say we want to display the top 10 processes using the most CPU. We want to display the process name and its CPU and Memory usage, and we want it to auto-refresh every minute:
New-PodeWebContainer -Content @(
    New-PodeWebChart -Name 'Top Processes' -Type Bar -AutoRefresh -ScriptBlock {
        Get-Process |
            Sort-Object -Property CPU -Descending |
            Select-Object -First 10 |
            ConvertTo-PodeWebChartData -LabelProperty ProcessName -DatasetProperty CPU, Handles
    }
)
which renders a chart that looks like below:
Data
You can pass static data to a Chart to be rendered by using the -Data parameter. This parameter can be used in general but is more appropriate to be used when rendering a new Chart as an action from another element - such as a Form to show "top X" processes.
Important
If you render a main Chart using -Data on your page the data will be static and unchanging on page loads - unless you render the Chart inside a -ScriptBlock of Add-PodeWebPage, but you'd be re-fetching the data on every page load which might impact the performance of loading the page as it will be synchronous, not asynchronous.
New-PodeWebContainer -Content @(
    Get-Process |
        Sort-Object -Property CPU -Descending |
        Select-Object -First 10 |
        ConvertTo-PodeWebChartData -LabelProperty ProcessName -DatasetProperty CPU |
        New-PodeWebChart -Name 'TopX' -Type Line -AsCard
)
Colours
A chart has 15 default colours that they can be rendered using. These colours can be customised if required, by supplying an array of hex colour codes to the -Colours parameter.
For example, to render the below bar chart with reg/green bars, you could use:
New-PodeWebContainer -Content @(
    New-PodeWebChart -Name 'Top Processes' -Type Bar -AutoRefresh -Colours '#ff0000', '#00ff00' -ScriptBlock {
        Get-Process |
            Sort-Object -Property CPU -Descending |
            Select-Object -First 10 |
            ConvertTo-PodeWebChartData -LabelProperty ProcessName -DatasetProperty CPU, Handles
    }
)
Append
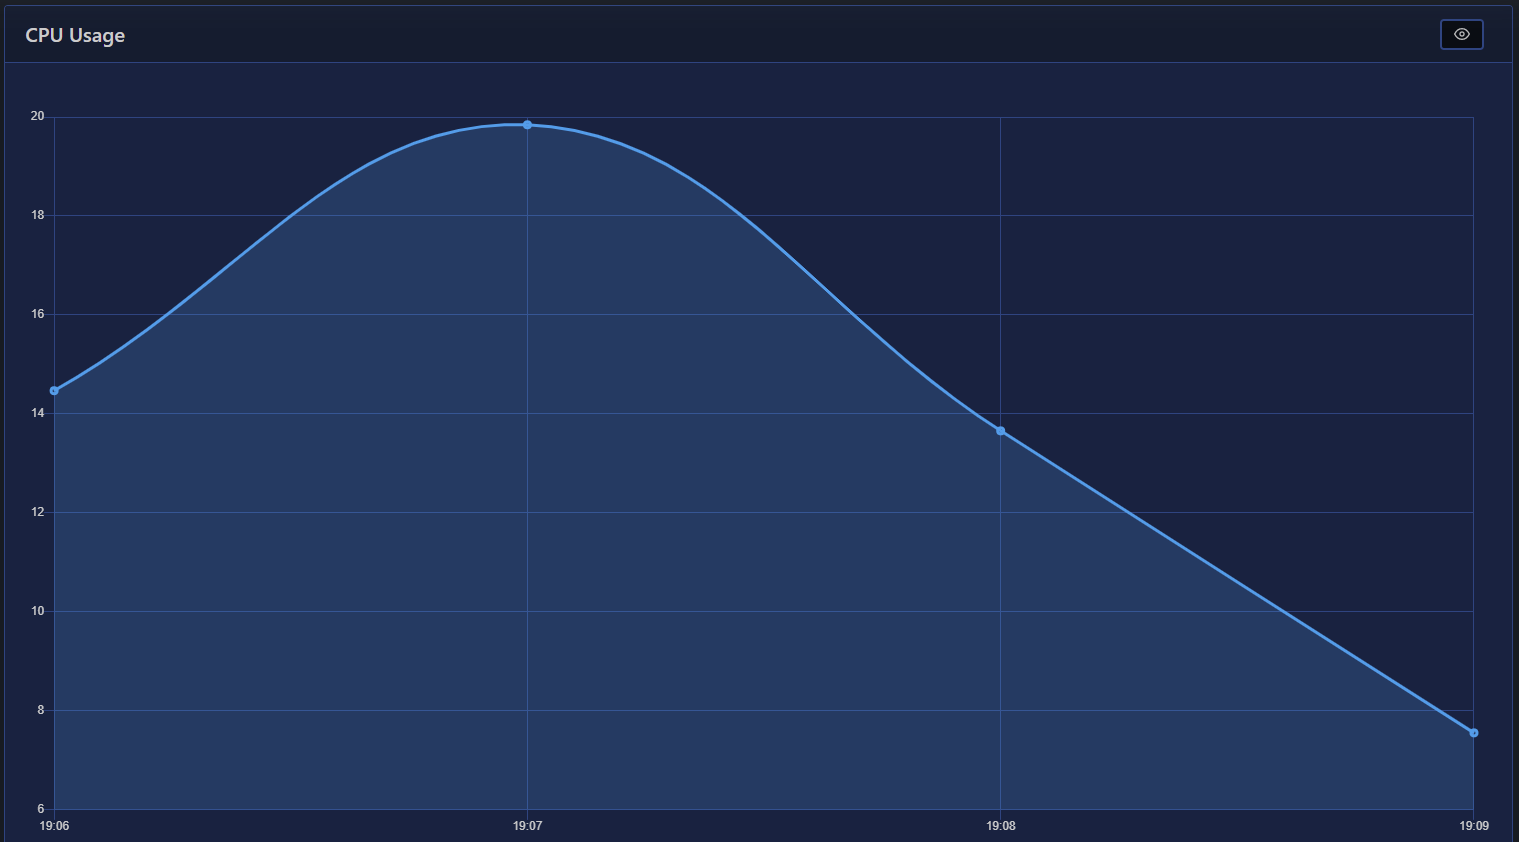
Now let's say we want -AutoRefresh a chart every minute, and we want it to display the current CPU usage, but only for the last 15 minutes. To do this, you have to supply -Append, and any data returned from the -ScriptBlock will be appended to the chart instead. To restrict the data points to 15 minutes, we can supply -MaxItems 15.
It would also be nice to have the X-axis labels be timestamps and Pode.Web can automatically show a data point's timestamp by using the -TimeLabels switch.
The below example would render this chart for us:
New-PodeWebChart -Name 'CPU Usage' -Type Line -AutoRefresh -Append -TimeLabels -MaxItems 15 -AsCard -ScriptBlock {
    return @{
        Values = ((Get-Counter -Counter '\Processor(_Total)\% Processor Time' -SampleInterval 1 -MaxSamples 2).CounterSamples.CookedValue | Measure-Object -Average).Average
    }
}
which renders a chart that looks like below:
First Load
The scriptblock has access to the $WebEvent, and when a chart requests its -ScriptBlock for the first time, $WebEvent.Data.FirstLoad will have a value of '1'. This will let you preload data on your chart on its first load, and then just return 1 data point thereafter to be appended.
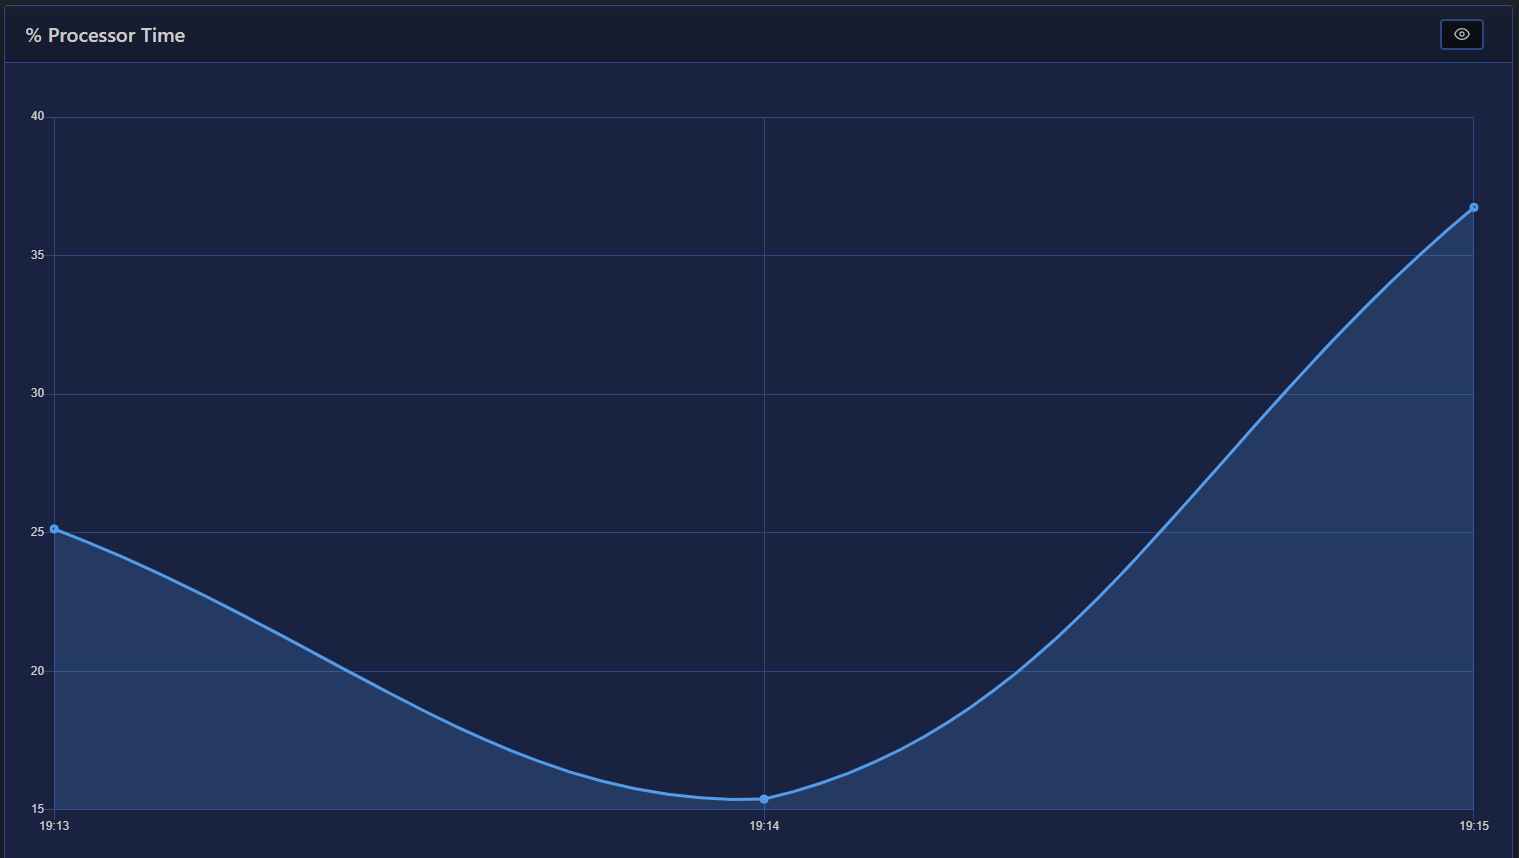
Windows Counters
To display line charts for Windows Performance Counters more easily, Pode.Web has an inbuilt New-PodeWebCounterChart. When used, this automatically sets up an auto-refreshing, timestamped, appending line chart for you; all you have to do is supply the name of the counter, and it will show a chart for up to the last 30 minutes.
For example, taking the above CPU example, this would be it using the inbuilt helper:
New-PodeWebCounterChart -Counter '\Processor(_Total)\% Processor Time' -AsCard
which renders a chart that looks like below:
Size
The -Height or -Width of a chart has the default unit of px. If 0 is specified then auto is used instead (or 100% for width). Any custom value such as 10% can be used, but if a plain number is used then px is appended - or you can use em values as well.
Note
When using % values, note that for -Width they are usually respected however, for -Height is is best to try an use literal values as the % isn't always respected.